Add Grafana
Grafana is the only service in this tutorial that requires a database. But it comes with an embedded sqlite3 database which can be stored in the filesystem on a mounted volume. So the data can be persisted and we can restart the service at any time without loosing any data.
Add a service
Add the following lines to your docker-compose.yaml to add the grafana service:
  grafana:
    container_name: grafana
    image: grafana/grafana:6.3.5
    depends_on:
      - "prometheus"
    restart: always
    networks:
      - kong-rover-demo
    environment:
      - GF_DATABASE_TYPE=sqlite3
      - GF_DATABASE_PATH=/mnt/data/
    volumes:
      - ./data:/mnt/data
    ports:
      - 3000:3000
Once we started our services we can access Grafana.
Configure service and dashboard
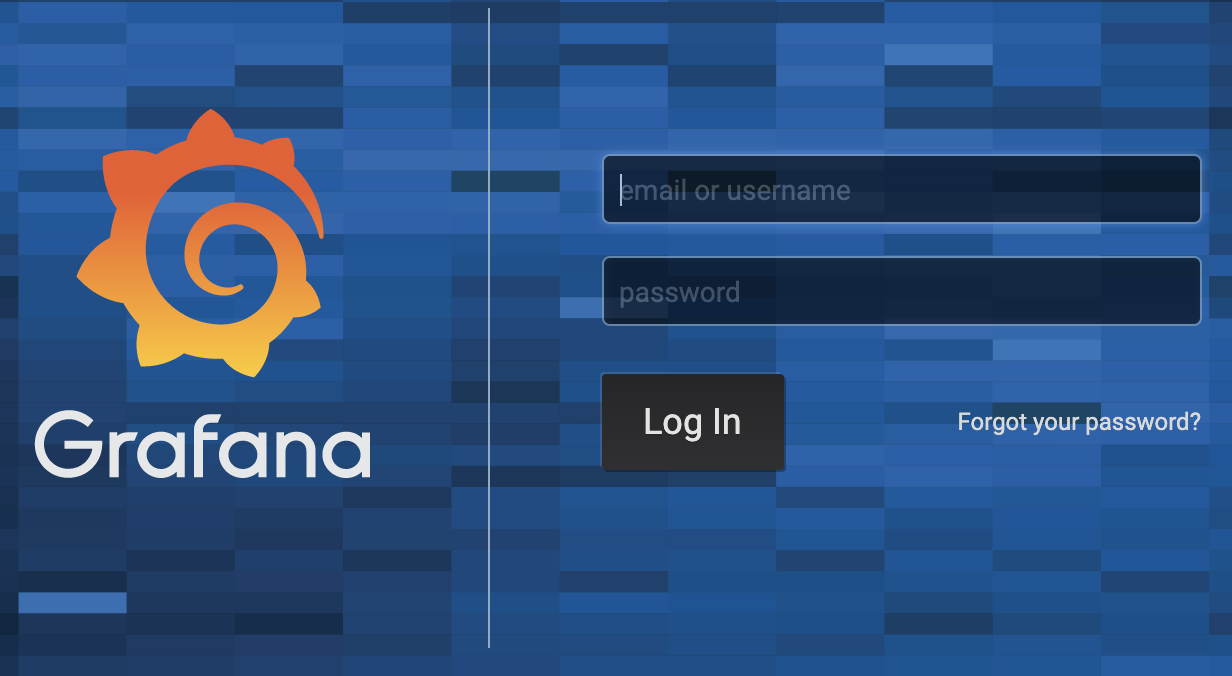
Grafana has a default admin user with username admin and password admin. At first login you will be prompted to set a new password:

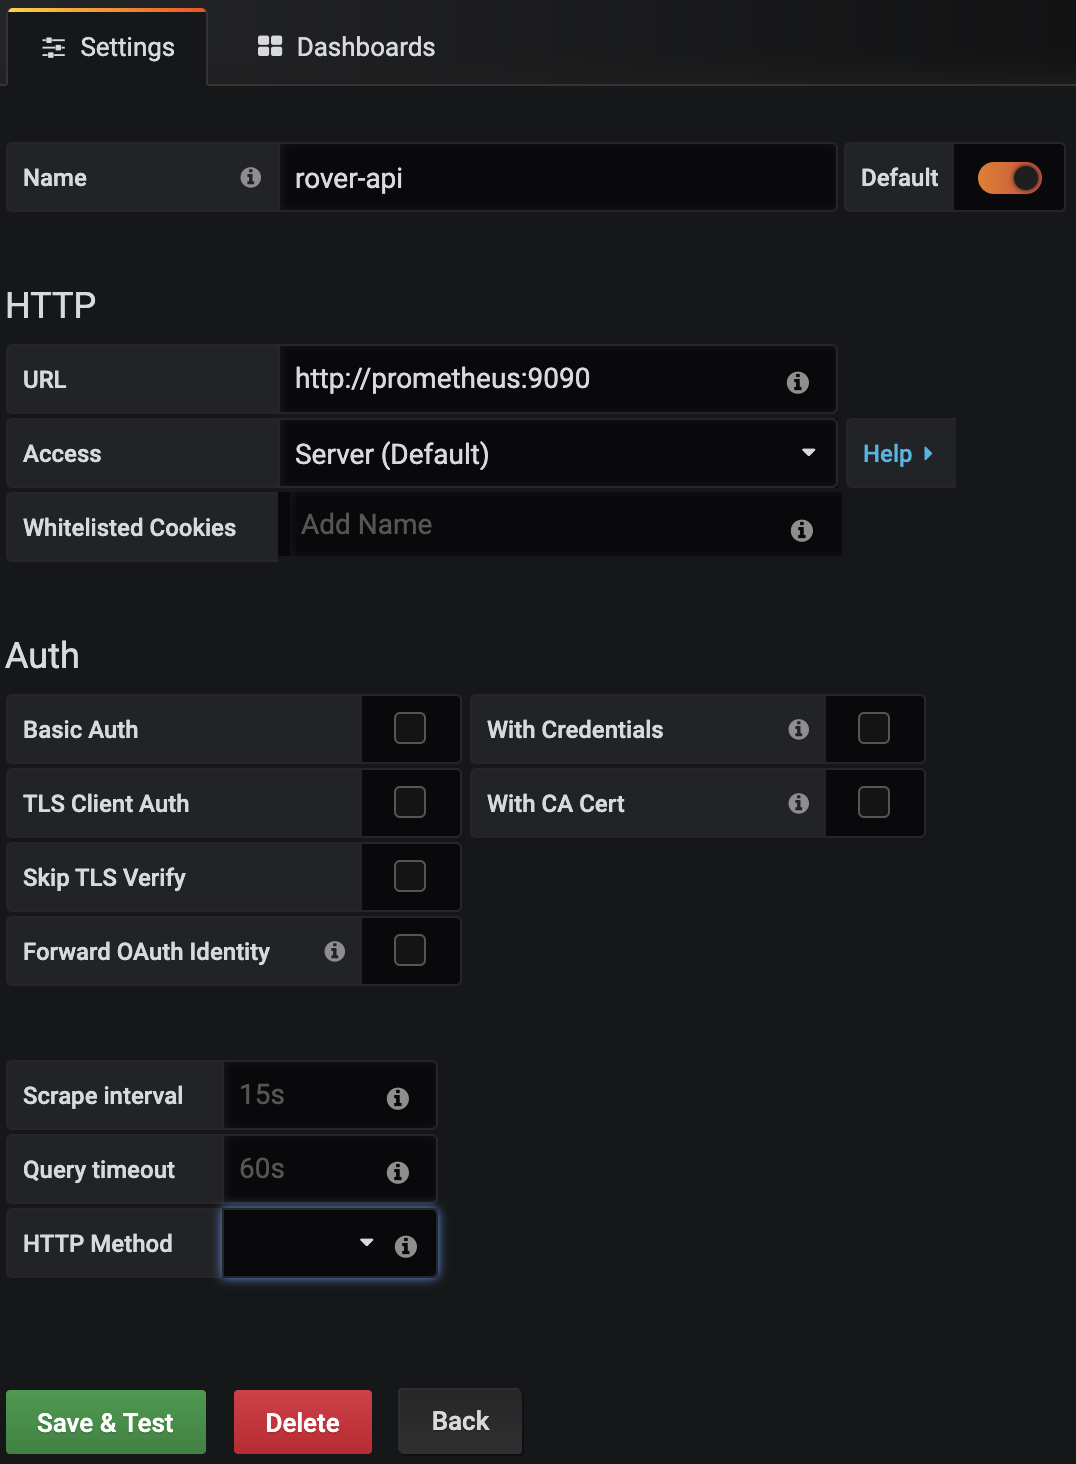
Once logged in we can add a new datasource, which connects Grafana to our Prometheus server.

Choose Prometheus as datasource and configure it according to the screenshot.

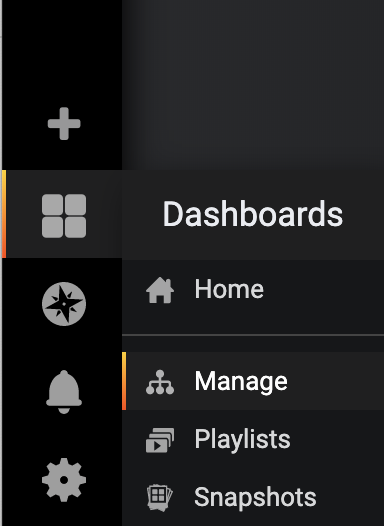
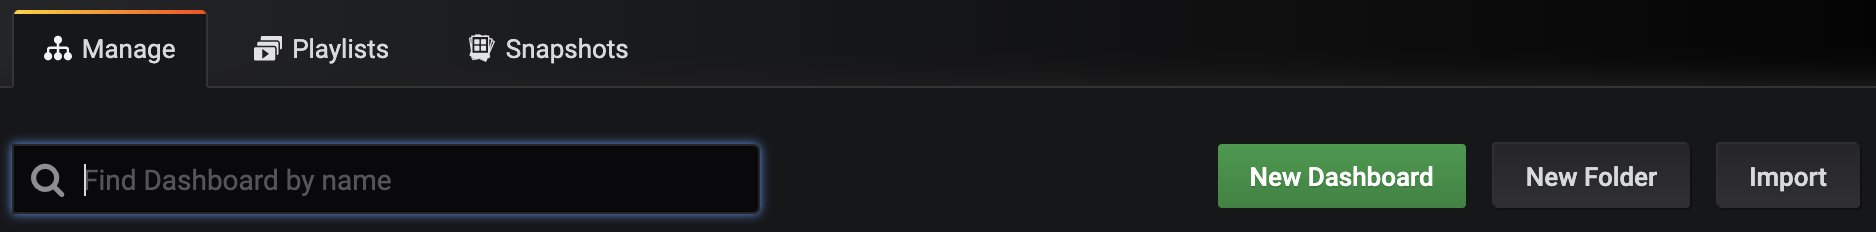
On the left select Dashboards | Manage and then import an existing dashboard.
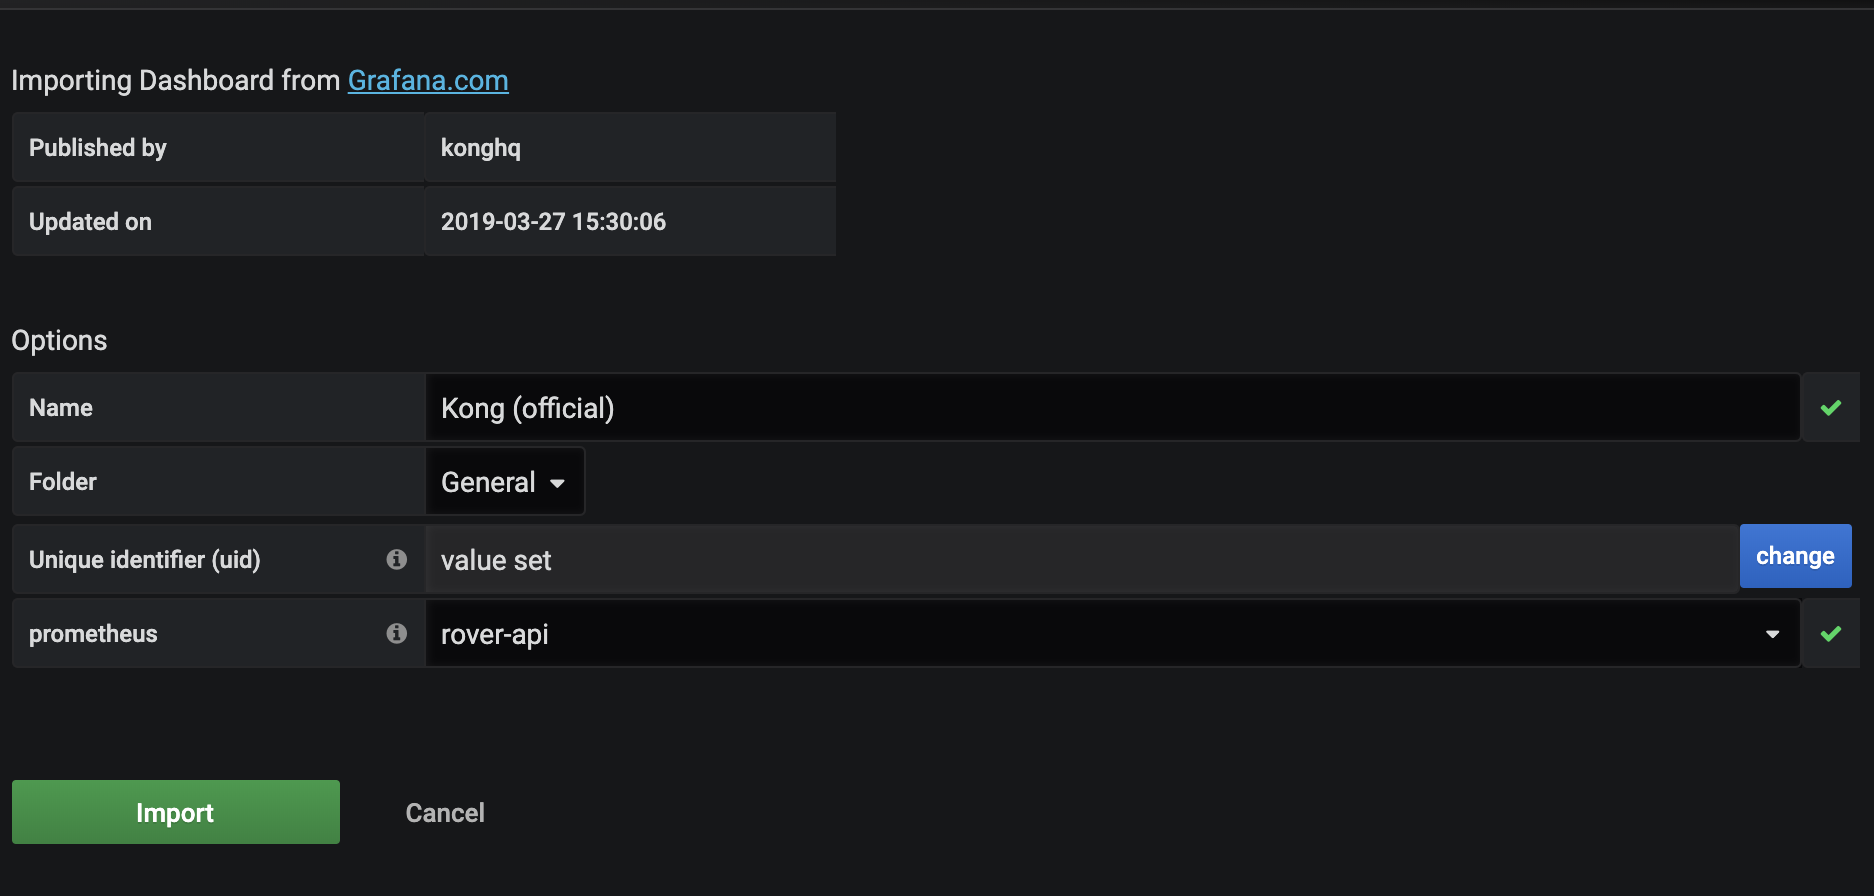
Now configure the dashboard as shown below. After finishing the configuration you will be forwarded to the dashboard.